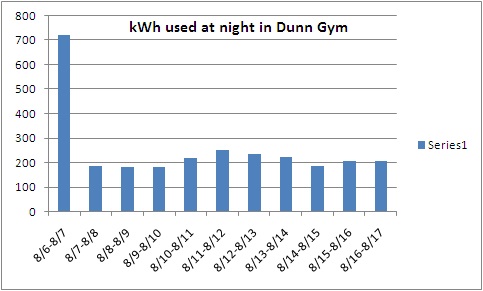
Today was our first day back from break, so we had some catching up to do. The first thing we did was to export the data collected over the past week to Excel Spreadsheet. We had data from 8/6-8/17 that covered all parts of the school, but our primary concern was to ascertain if the problem with the gym was fixed. On August 6, David, one of the technicians at Andover High, came and determined the cause of the excessive energy use at night and fixed it. Using the data over the last week, we took a look at the kWh consumed at night in the Dunn Gym. This is what we found.
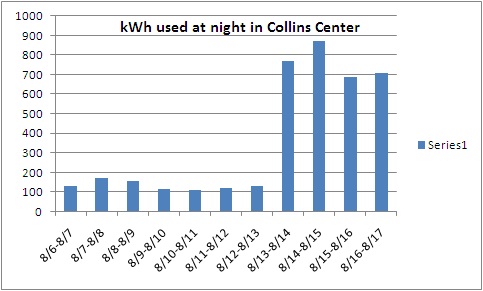
It can be seen that in the days following August 6, the energy usage in the Dunn Gym decreased significantly and remained steady throughout the week. Now we know for certain that the problem we once had in the Dunn Gym has been resolved. Today, I made graphs that represented the energy consumption of each of the six panels at night as well. All of them were roughly what I expected them to be, but the graph of the Collins Center was very startling.
Very evident in this graph is the immense rise in usage that begins at 8/13. Now that we have solved the problem revolving around the mysterious energy consumption in the gym, our next step is to determine what's going on in the Collins Center.


 RSS Feed
