Activity Log
January 9, 2015: First meeting. We discussed the ongoing problem at the school and brainstormed ideas on both why this is happening and possible solutions.
January 16 - End of February: Learned a lot about the ins and outs of the schools energy usage.
March 10: Began going around the school to see how many items in the school were using up energy around the clock.
March 24: Began to use BERTs to analyze data consumption of different items at different times of the day. A few of these BERTS were placed at different places around the school.
March 31: Collected BERTs and analyzed data. Found that certain objects consumed more energy at different times of the day.
May 5: Took a trip to the boiler room to get a better understanding of how the school's water supply is heated and took a look at the school's generator.
May 19: Began working on websites
July 8: This morning we tried to review trends in energy consumption, but technical difficulties prevented us from doing so. Hopefully we will have a better understanding of the Metasys software so that we can access these things in future meetings. Afterwards, we headed to the high school to learn more about the school energy consumption.
When we went to Andover High, we immediately noticed that while school is not in session, there were a multitude of objects consuming energy in the Library. While at the school, we learned about three phase electricity. Three phase electricity is a way to transfer power across long distances. First, a generator turns mechanical energy into electrical energy. Then, that energy is transferred through multiple wires to its destination. This is especially useful for transporting large amounts of energy. Three phase electricity is commonly used by electricity providers to deliver energy through long distances to their consumers.
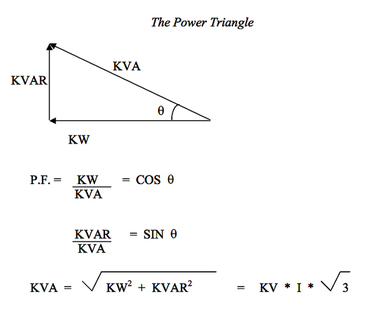
Also, we learned about power factor. Power factor can be found by using the formula KW divided by KVA, or the ratio of working power to apparent power. Power factor has a range of values from 0-1. The power factor determines how effecient a system is. To maximize efficiency, power factor is closest to 1. To find the power factor, use the power triangle. CosΘ can find the power factor, as it is KW/KVA. Therefore, to maximize efficiency, KVAR ideally has a small value, and KVA would roughly be the same value as KW.
July 9:
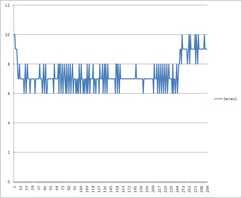
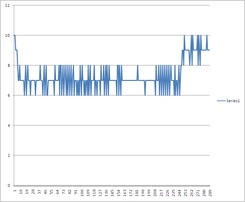
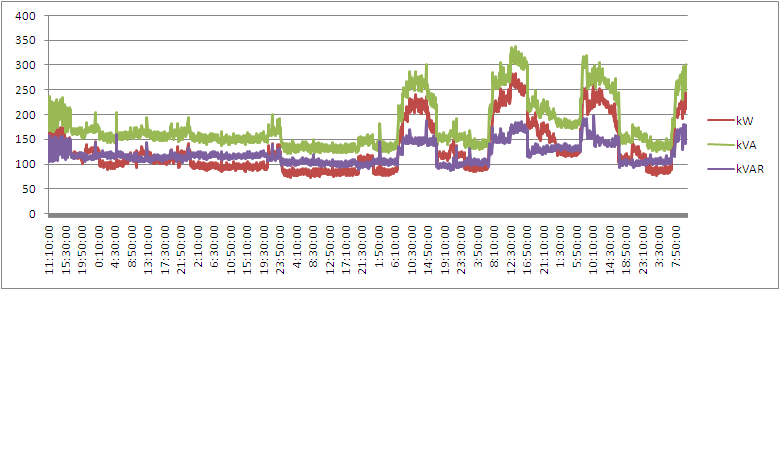
These are graphs that represent the energy consumption at AHS from the beginning of July 4 to the end of July 5, a Saturday and a Sunday, respectively. A few things can be observed by looking at some trends in the graphs. First, energy usage in the school stays constant most of the day, hovering around 6-8 kilowatts. However, at around 9-10 P.M. there is a spike in the usage. Rather than stay at 6-8 kilowatts, the energy usage increases by 20-25%, staying at around 8-10 kilowatts until 1 A.M the next day. At this time, the energy usage reverts back to its usual self. If we can find out what is causing this increase in energy, then we can save a lot of money in energy costs.
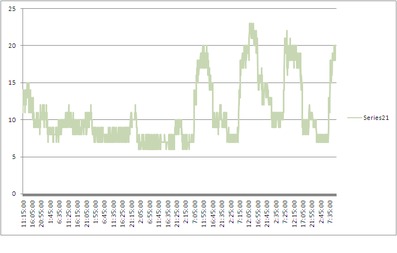
This graph shows the overall energy consumption of the school over a weeks time. Much like the previous graphs, there are a few things that can be observed.
July 10: Today we started off with a lesson on 3 phase electricity and its usages. In addition, we also learned about how magnets work, and how wrapping a coil around one creates an electromagnet. Then, we made some more graphs that were based off of the graphs we made on the 9th. Later, we made some adjustments to the Metasys system so that we could look at more of the data on energy consumption. Previously, we could only access data from the past 7 days. After some trial and error, we were able to find a solution to this problem. By changing the the "repository enabled" from false to true, this allowed us to access more data. In future meetings, we will definitely use this additional data and try to gain more information from it.
July 14: Most of the day was spent visiting the town's water plant and a large field of solar panels. First, we headed to the town's water plant near Hagget's Pond. There, we were given a tour of the plant's facilities and received more information of how water is transferred throughout the town. We also took a few photos of the nameplates on some of the pumps so that we could analyze them when we went back to the high school. We learned that there are several water storage facilities around the town, some of which are located at Wood Hill and Bancroft. These facilities can hold upwards of 13 million gallons of water.
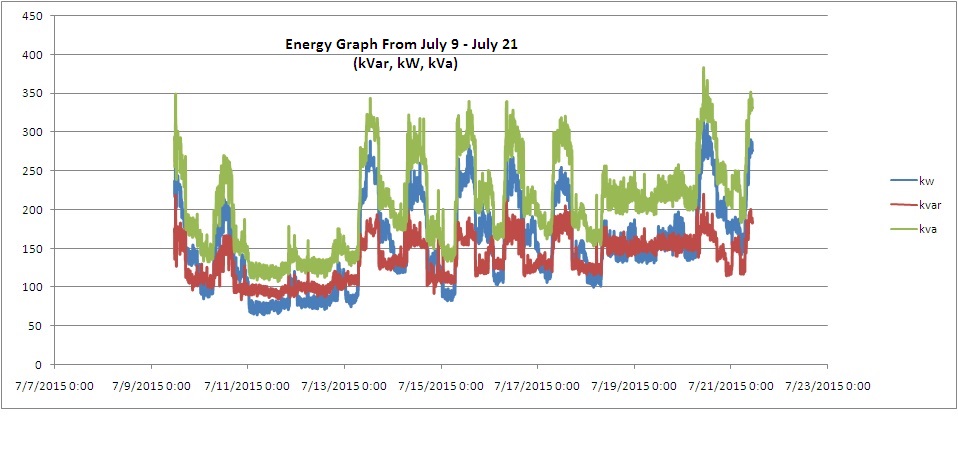
July 23: Much of today was spent creating graphs of the new data we collected. After a week-long break, we had data all the way up to July 22nd. In fact, there was so much data that we had to sift through a lot of it just so we could find the few data points that were of use to us.
This graph is much as we expected it to be, with the energy peaking on weekdays and it staying relatively stagnant on the weekends.
